This project asks how retail and primary healthcare access is distributed across Toronto. I mapped Shoppers Drug Mart pharmacies, physician offices, and hospitals to compare the geography of routine healthcare touchpoints.
The point of the map is not only to show where services exist. It asks whether different forms of healthcare access cluster in the same neighbourhoods, or whether pharmacy coverage is masking weaker access to physicians.
The raw datasets did not share clean address fields. Instead of forcing an address-based geocode, I used existing coordinate columns and converted them directly into point layers with ArcGIS Pro's XY Table To Point tool.
- InputOntario GeoHub tables for pharmacy, physician, and hospital locations.
- ProjectionNAD 1983 UTM Zone 17N, selected for accurate distance measurement in Toronto.
- ValidationManual extent checks confirmed that points landed inside the study area.
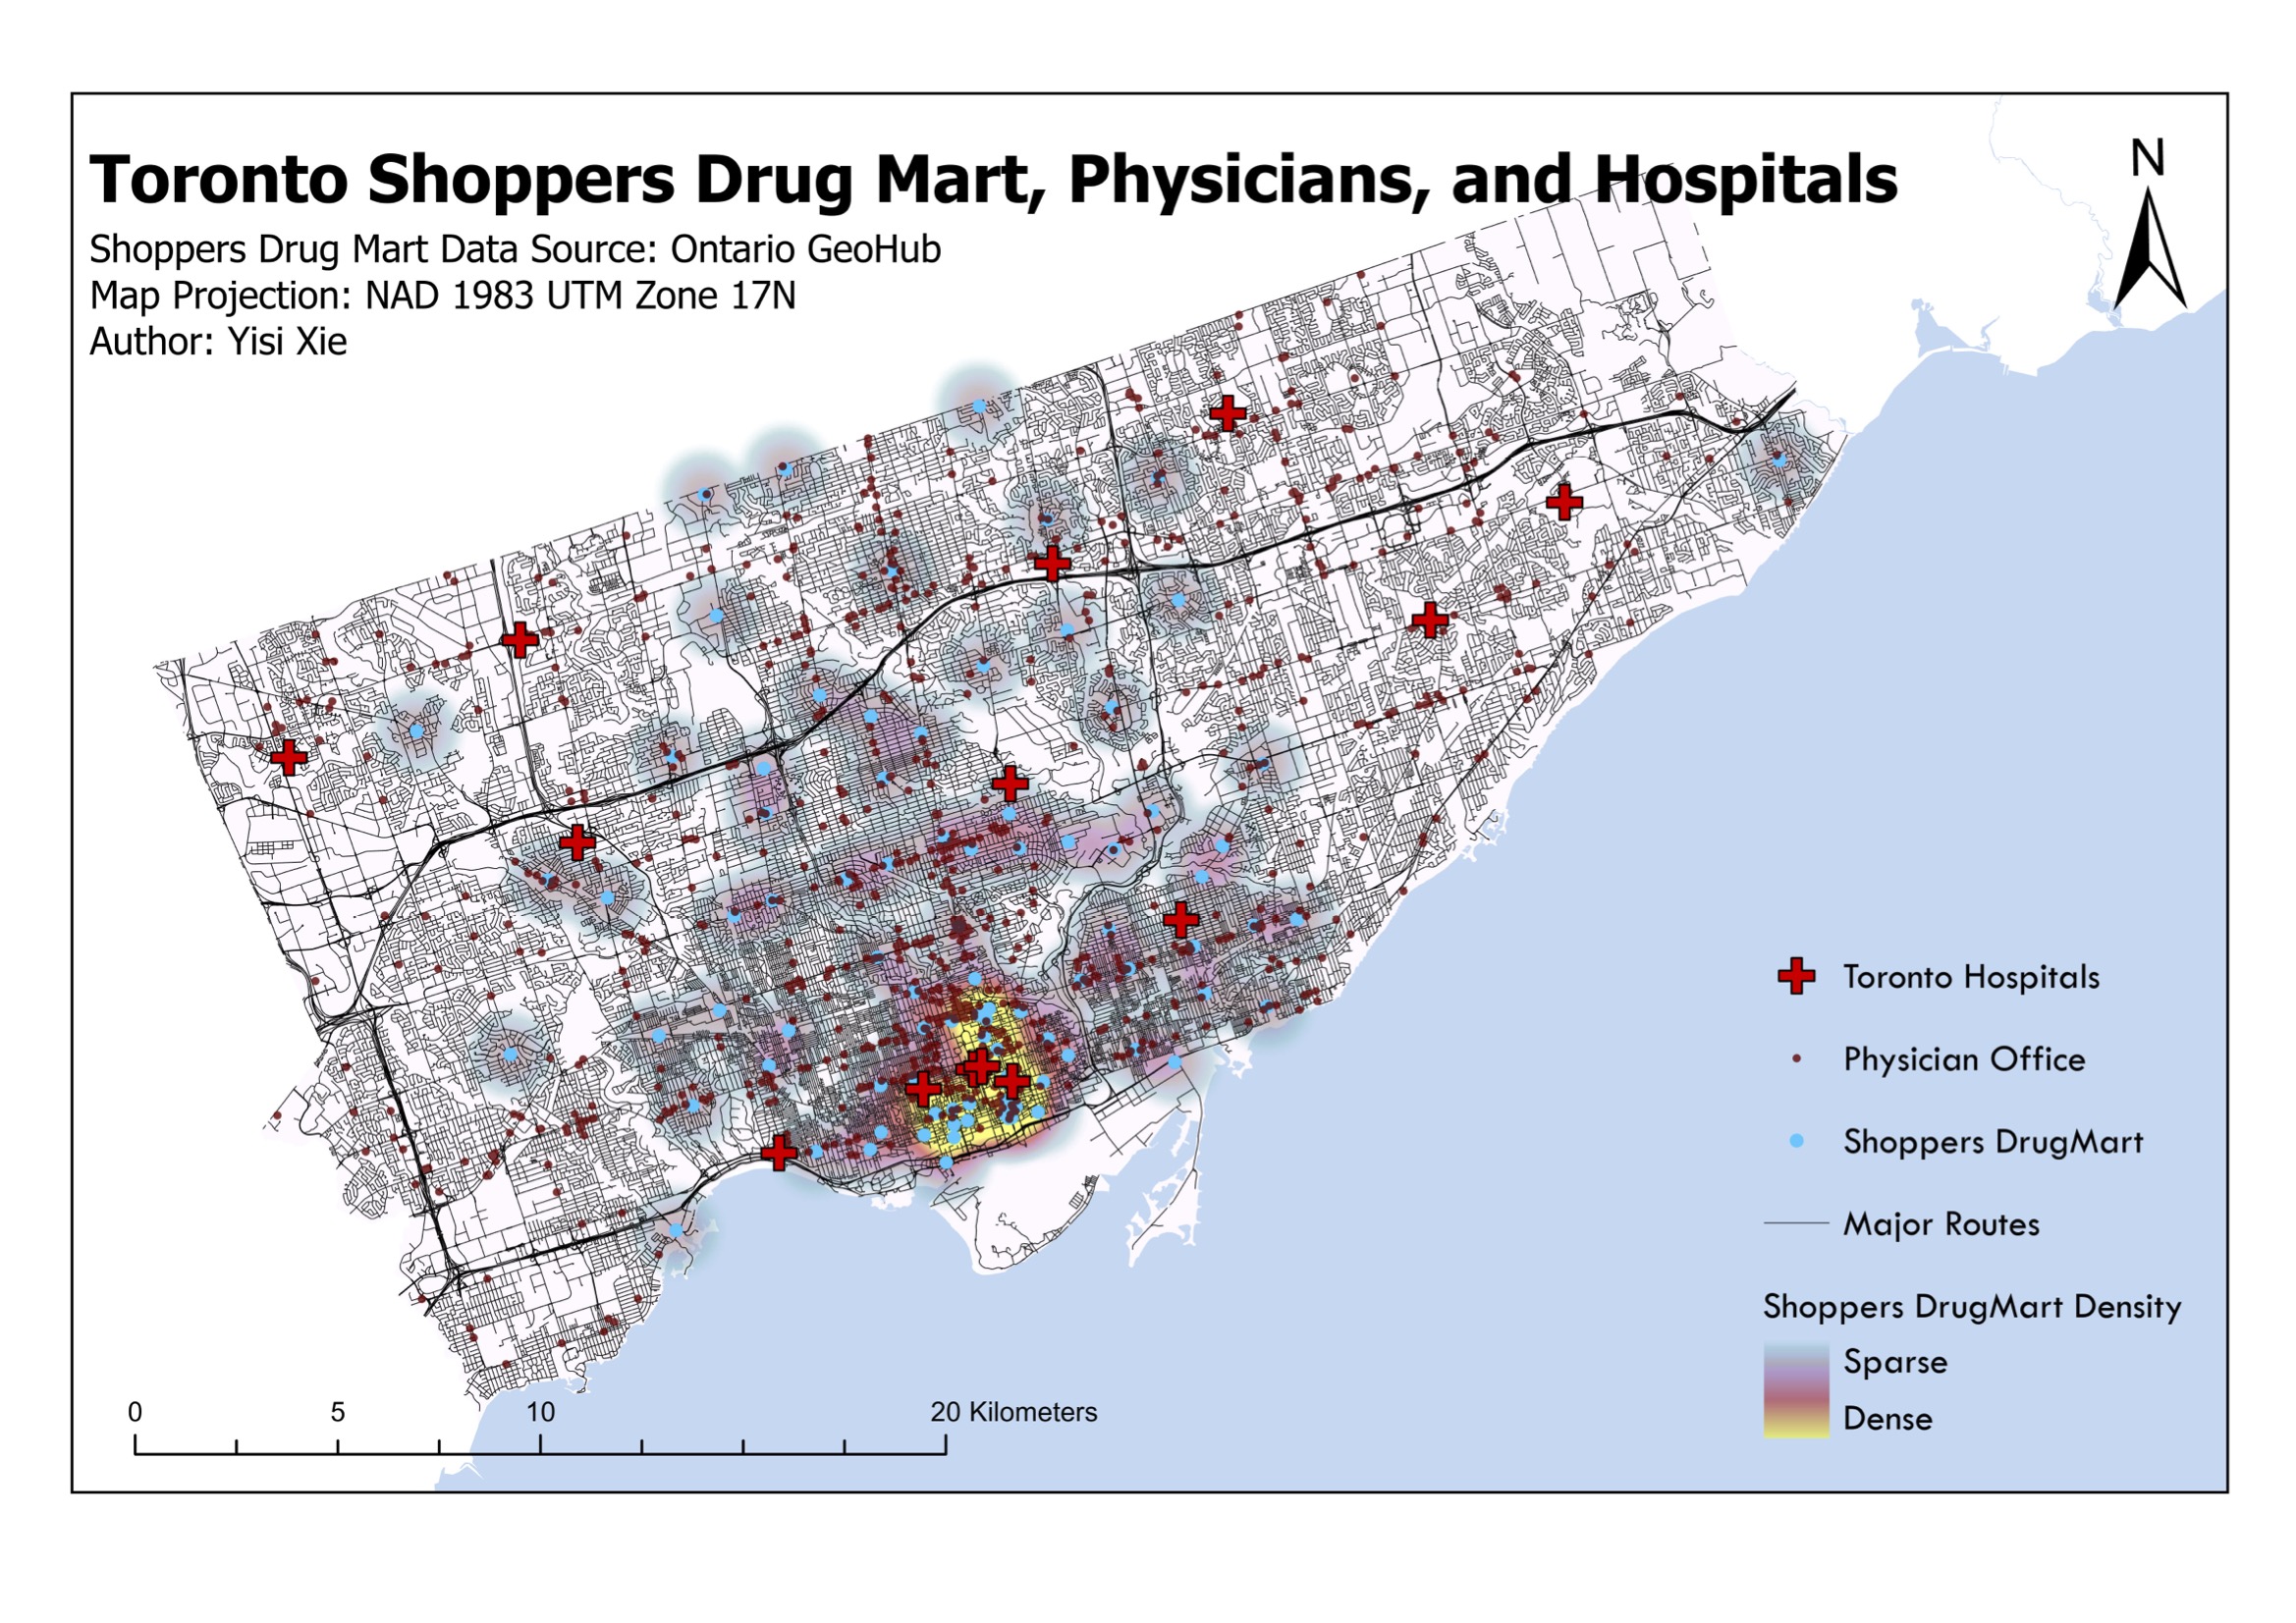
- AnalysisKernel Density Estimation translated pharmacy points into a continuous service-density surface.
Shoppers Drug Mart locations are relatively well distributed across Toronto, with strongest density in the central corridor and secondary clusters along major arterials. Physician offices, by contrast, appear more corridor-dependent.
This matters because retail pharmacy access can create a feeling of healthcare coverage while primary care remains uneven. A resident may be close to medication pickup, but still far from routine physician care.
The model does not include opening hours, appointment availability, insurance and language access, sidewalk quality, or transit travel time. It is a spatial first pass: useful for seeing structure, not sufficient for measuring lived access on its own.